Key performance review
Measuring our progress
Financial
REVENUE FROM OPERATIONS
(INR Crores)
- FY 22-23 13,783
- FY 21-22 12,425
- FY 20-21 11,602
 11% (10%*)
EBITDA
(INR Crores)
- FY 22-23 1,874
- FY 21-22 1,749
- FY 20-21 1,569
7%
PROFIT BEFORE TAX AND EXCEPTIONAL ITEMS
(INR Crores)
- FY 22-23 1,634
- FY 21-22 1,508
- FY 20-21 1,342
8%
GROUP NET PROFIT
(INR Crores)
- FY 22-23 1,320
- FY 21-22 1,015
- FY 20-21 930
30%
RETURN ON CAPITAL EMPLOYED (ROCE)#
(%)
- FY 22-23 34.3
- FY 21-22 32.8
- FY 20-21 34.7
DIVIDEND
(%)
- FY 22-23 845
- FY 21-22 605
- FY 20-21 405
40%
Segmental
INDIA BUSINESS
(INR Crores)
- FY 22-23 8,717
- FY 21-22 7,914
- FY 20-21 7,003
 10%
10%
INTERNATIONAL BUSINESS
(INR Crores)
- FY 22-23 3,589
- FY 21-22 3,336
- FY 20-21 3,508
8% (6%*)
NON-BRANDED BUSINESS
(INR Crores)
- FY 22-23 1,500
- FY 21-22 1,214
- FY 20-21 1,122
24% (21%*)
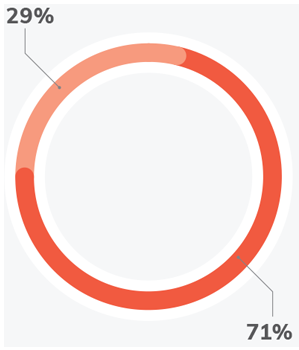
REVENUE – BRANDED BUSINESS IN
FY 22-23
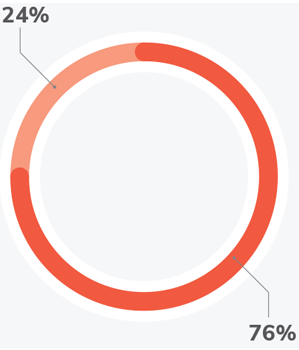
PROFIT BEFORE TAX – BRANDED BUSINESS IN FY 22-23

Environmental
GHG EMISSIONS SCOPE 1
(MT CO2e)
- FY 22-23 6,834
- FY 21-22 11,145
- FY 20-21 13,328
GHG EMISSIONS SCOPE 2
(MT CO2e)
- FY 22-23 19,847
- FY 21-22 20,309
- FY 20-21 19,169
100%
EPR compliance in India. All our Beverages production facilities globally are zero waste to landfill since 2019
314 Million litres
Of water recharged through Project Jalodari. It will contribute to same amount of recharge annually going forward
Founding member
Of the India Plastics Pact
Governance
0%
Independent Directors on Board
0%
Non-Executive Directors on Board
0%
Average Board meeting attendance
0%
Average Audit Committee attendance
0%
Members of the Audit, Risk Management and CSR and Sustainability Committees are Independent Directors
0%
Non-promoter holding
0
Directors in the age group of 40-60 years
0
Directors in the age group of 60-65 years

Proxy Advisory Firms recommended Vote in favour for all shareholder’s resolutions proposed in FY 22-23
0%
Average voting in favour on all shareholder’s resolution passed in
FY 22-23
Social
INVESTMENTS IN CSR PROGRAMMES
(INR Crores)
- FY 22-23 16.6
- FY 21-22 13.5
- FY 20-21 12.0
 23%
23%
 increase % vs PY
*Constant currency growth | # Capital employed= Tangible Net Worth (includes non current investments) + Total Debt + Deferred Tax Liabilities