Welcome to
Interactive Annual Report 2021-22


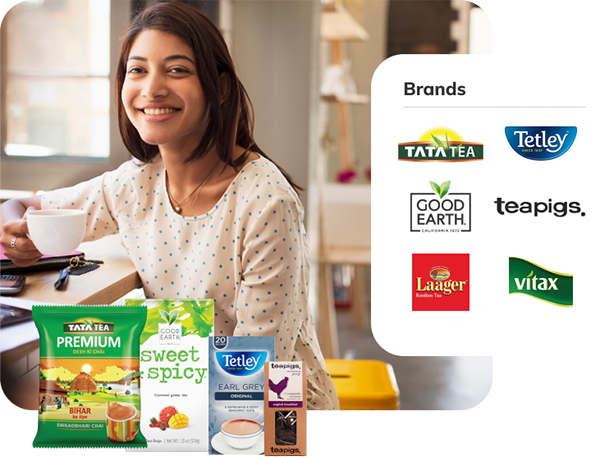

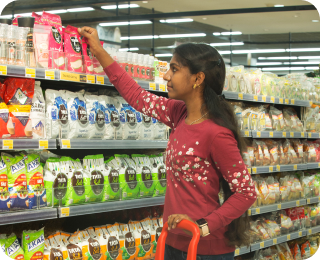
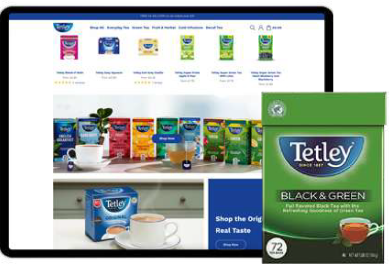
TEA
Black tea | Specialty tea | Fruit & Herbal tea | Cold infusions | Iced tea | Ready-to-drink tea


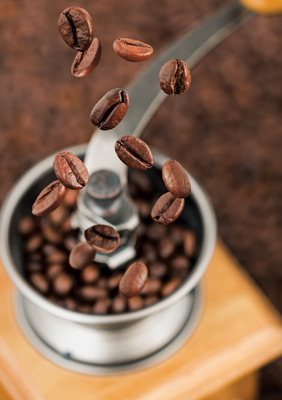
COFFEE
Whole bean | Roast & Ground | K-Cups/coffee pods | Instant coffee
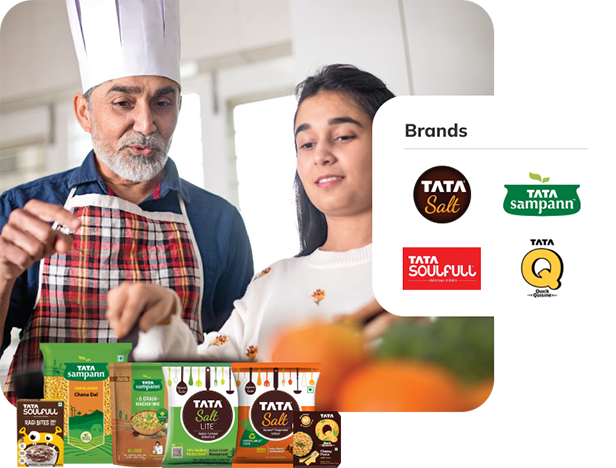
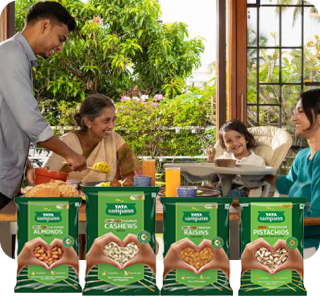
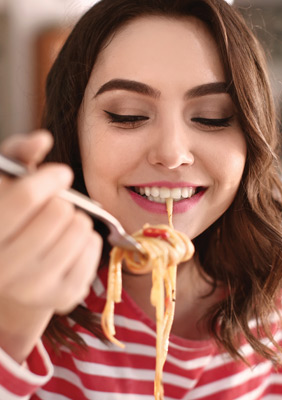
FOODS
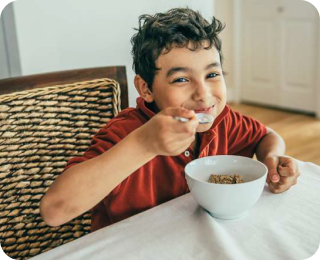
Salt | Pulses | Besan (Chickpea flour | Poha (flattened rice) | Spices | Ready-to-cook mixes | Dry Fruits | Millets based breakfast cereals and snacks | Ready to Eat
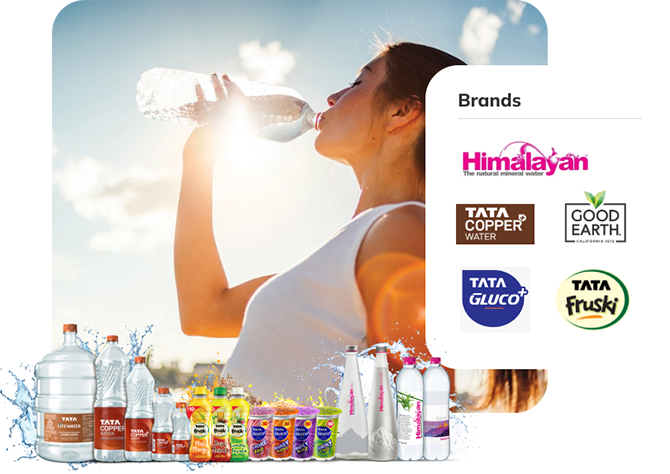
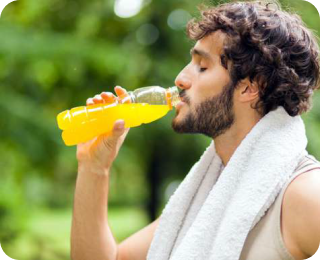
LIQUID BEVERAGES
Natural mineral water | Packaged drinking water | Functional beverages | Other


OUT-OF-HOME
Cafes
Our presence
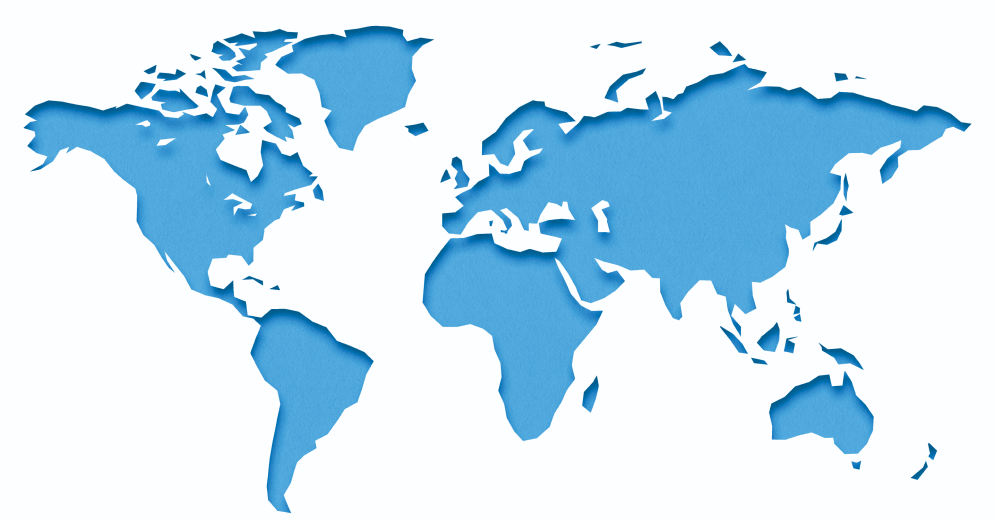
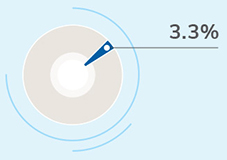
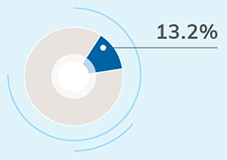
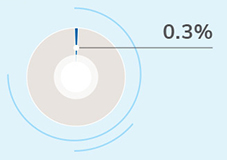
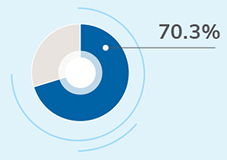
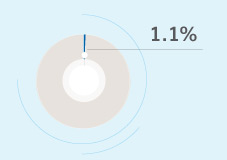
Workforce by region
India
USA
UK
Other regions


Tea

Coffee

Foods

Liquid Beverages

Out-of-Home
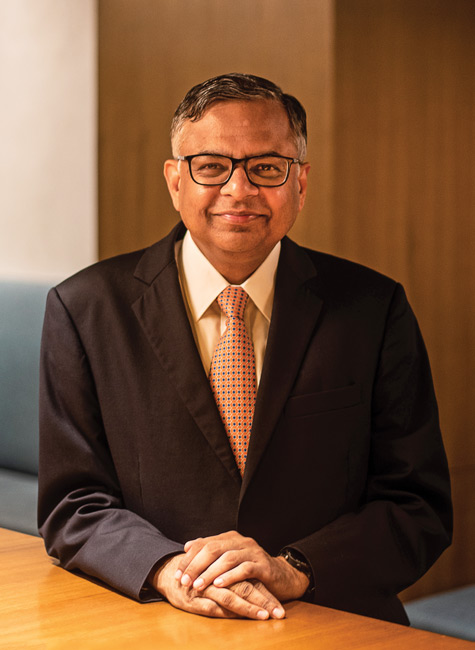 N. Chandrasekaran Chairman
Chairman’s letter
"As I had shared with you in last year’s Annual Report, we had identified six strategic priorities for the business. These priorities are key building blocks that power the Company’s growth agenda, and I am pleased to report that we have made substantial progress against each of these during the course of this year."
Know More Meet the board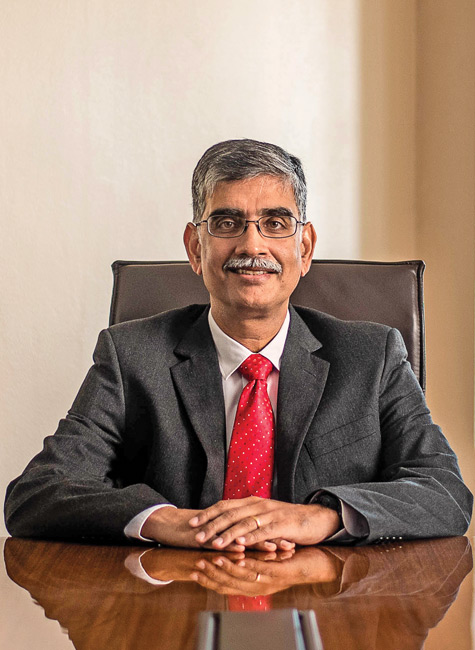 Sunil D’Souza MD & CEO
Message from the MD and CEO's desk
"We will continue to leverage the trust that the brand inspires, expand our portfolio and increase our footprint to reach more consumers in India. Currently, we reach over 201 million+ households in India and distribute to over 2.6 million outlets."
Know More Meet the Leadership teamKey performance review
REVENUE FROM OPERATIONS
(INR CRORES)

7% (9%*)
increase
EBITDA
(INR CRORES)
11%
increase
PROFIT BEFORE TAX AND EXCEPTIONAL ITEMS
(INR CRORES)
12%
increase
GROUP NET PROFIT
(INR CRORES)
9%
increase
RETURN ON CAPITAL EMPLOYED
(ROCE) (%)
INDIA BUSINESS
(INR CRORES)

13%
increase
INTERNATIONAL BEVERAGES
(INR CRORES)
-5% (1%*)
increase
NON-BRANDED BUSINESS
(INR CRORES)
8%
increase
GHG EMISSIONS
(MTCO2e)

The increase in GHG emissions between FY 19-20 to FY 21-22 is because of the integration of the Foods business and addition of a new location to the operational
*Assurance underway
RENEWABLE ENERGY
(%)
EPR compliance in India. All our Beverages production facilities globally are zero waste to landfill since 2019
Of water recharged through Project Jalodari. It will contribute to same amount of recharge annually going forward
Of the India Plastics Pact
TOTAL LEARNING HOURS
(HOURS)
INVESTMENTS IN CSR PROGRAMMES
(INR CRORES)
Enabled by Our Strategic Priorities
S1 ![]()
During the year, we invested in our brands, and expanded into new target markets with impactful campaigns and premium products. We gained market share in our core categories while stepping up innovation across our portfolio.
Know MoreEnabled by Our Strategic Priorities
S2 ![]()
We are leveraging the power of digital to gain new market and consumer insights while optimising resources and processes.
Know MoreEnabled by Our Strategic Priorities
S3 ![]()
We are making the organisation more effective and agile on multiple fronts. It was a year of unlocking synergies, with acquisitions and divestments, restructuring initiatives, and fast-tracking the integration of newly acquired businesses. We will continue to optimise and transform the supply chain For Better.
Know MoreEnabled by Our Strategic Priorities
S4 ![]()
We are continually exploring and evaluating new opportunities to grow - both organically and inorganically. During the year, we entered the Ready to Eat category with Tata Q, expanded into new markets with Tata Sampann, accelerated the growth momentum for NourishCo, multiplied the reach of Tata Soulfull and forayed into the energy drinks market in the UK with Good Earth. Tata Starbucks recorded its highest ever number of store openings during the year.
Know MoreEnabled by Our Strategic Priorities
S5 ![]()
We are strengthening our future readiness by building a purpose-led organisation, augmenting our capabilities across businesses and fostering an inclusive culture. We are also leveraging technology and scaling our supply chain for better effectiveness and agility.
Know MoreEnabled by Our Strategic Priorities
S6 ![]()
At Tata Consumer Products, we operate our business in a manner that strives for better nutrition, better sourcing, better communities and a better planet.
Know More
Value creation model

Financial Capital
Sources of funds debt: INR 1,468 Crore; equity INR 1,6294 Crore

Intellectual Capital
R&D expenditure: INR 23.87 crores in 2021-22

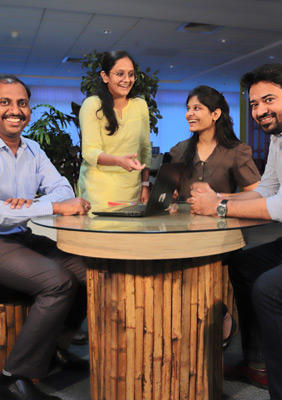
Human Capital
Global employee strength: 3,700+

Social & Relationship Capital
Community: Spent INR 13+ crore; 5 thematic areas; 8+ partnerships for CSR implementation

Natural Capital
Water used for operations: 1.7 lakh KL

Manufactured Capital
119 locations worldwide (including manufacturing units, corporate offices and dedicated third party units)

Financial Capital
Revenue from operations: INR 12,425 crore; Market Capitalisation: INR 71,645 crore

Intellectual Capital
25 new products launched in India and other geographies

Human Capital
Employee advocacy: Internal transfers and referrals filling 50% of the open positions

Social & Relationship Capital
Community: 8 CSR programmes positively impacting 8 lakh beneficiaries

Natural Capital
Responsible manufacturing operations: Zero waste to landfills across beverage units, 7,000+ tonnes of recycled material in packaging

Manufactured Capital
1.44 million tonnes of production globally
Financial Capital
Growth in consolidated revenue: 7% and net profits: 9%
Intellectual Capital
Innovation to sales: 2x of previous year
Human Capital
Future-ready workforce
Social & Relationship Capital
Driving premiumisation – scaling up our premium portfolio across core categories
Natural Capital
Strong advocacy of environmental stewardship extending beyond our boundaries
Manufactured Capital
Agile and future-ready manufacturing facilities
Safety enhancement by automation