Focused Execution.
For Better.
Integrated Annual Report 2022-23


Integrated Annual Report 2022-23

The Company has continued to invest in the future growth engines of its portfolio, and this has started delivering results, with the growth businesses recording 53% growth and increasing their salience significantly.
N. Chandrasekaran Chairman
Over the last three years we have built capabilities and laid a solid foundation that has propelled us and will stand us in good stead as we strive for accelerated growth.
Sunil D’Souza MD & CEO
 11% (10%*) 7% 8% 30% 40%
* Constant currency growth | # Capital employed= Tangible Net Worth (includes non current investments) + Total Debt + Deferred Tax Liabilities
 10% 8% (6%*) 24% (21%*)
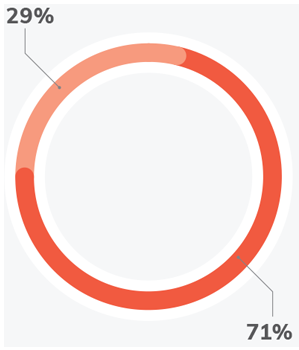

EPR compliance in India. All our Beverages production facilities globally are zero waste to landfill since 2019
Of water recharged through Project Jalodari. It will contribute to same amount of recharge annually going forward
Of the India Plastics Pact
Independent Directors on Board
Non-Executive Directors on Board
Average Board meeting attendance
Average Audit Committee attendance
Members of the Audit, Risk Management and CSR and Sustainability Committees are Independent Directors
non-promoter holding
Directors in the age group of 40-60 years
Directors in the age group of 60-65 years

Proxy Advisory Firms recommended Vote in favour for all shareholder’s resolutions proposed in FY 22-23.
Average voting in favour on all shareholder’s resolution passed in FY 22-23
 23%
23%


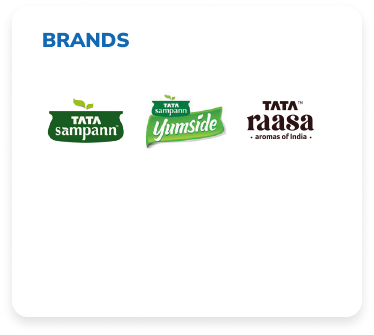


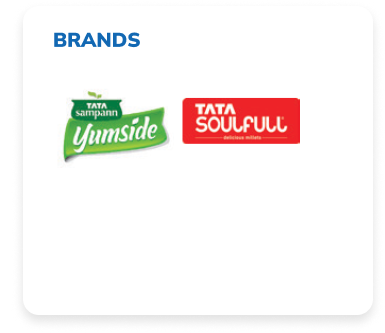

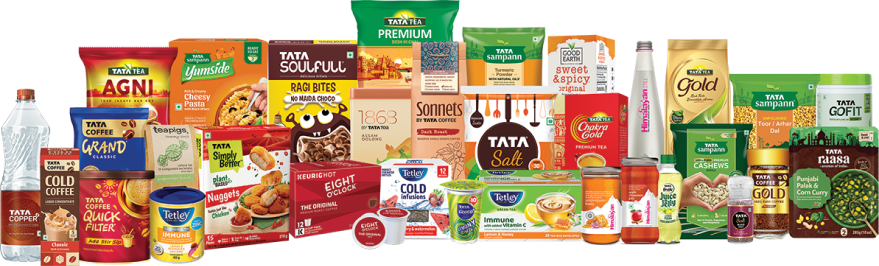


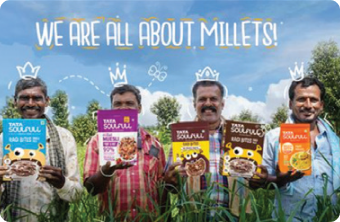
*India Growth businesses include Tata Sampann, NourishCo, Tata Soulfull, and Tata Smartfoodz (RTE/RTC Business).


WE ARE GUIDED BY OUR VALUES TO FULFILL OUR MISSION
Our sights are set on playing an increasingly more significant role in the consumer products market. We are committed to building better lives and thriving communities and helping create a better world for everyone.
Know MoreTO ACHIEVE OUR BUSINESS GOALS, WE HAVE SIX STRATEGIC PRIORITIES

Strengthen and accelerate core business

Drive digital and innovation

Unlock synergies

Explore new opportunities

Create a future-ready organisation

Embed sustainability
CREATING A LASTING POSITIVE IMPACT ON OUR STAKEHOLDERS

Consumers

People
Communities

Government and regulatory authorities

Investors

Value chain partners

Environment and ecosystem
PURPOSE-DRIVEN ORGANISATION
We are a future-ready, purpose-led organisation, with people as our strength. Hence, we focus on their progress, creating a safe and equitable workspace in our journey ‘For Better’.
Global Branded Workforce strength
Invested in Trainings
Women in workforce
OPERATIONAL EXCELLENCE
Our strategically located manufacturing and packaging facilities and a centralised product supply organisation help deliver high-quality products to our consumers.
Locations worldwide (including manufacturing units, corporate offices and dedicated third party units)
World-class R&D facilities to drive product innovation
CONSUMER CENTRICITY
High quality products that cater to consumer needs are our value proposition to our consumers. Higher levels of consumer awareness and demand have led to newer ways of staying connected.
STRATEGIC PARTNERSHIPS
We are transforming our supply chain to better serve our customers efficiently in a competitive market. Having pioneered sustainable tea and coffee sourcing via partnerships, we are committed to replicating it for the other parts of our product portfolio.
Directly serviced outlets
Distribution partners (including retailers and D2C)
INNOVATION AND DIGITALISATION
Leveraging our digital and R&D capabilities, our portfolio of great-tasting products is designed to cater to evolving consumer needs. This year, we focused on integrating digital capabilities across business units and partner ecosystems.
SUSTAINABILITY FOCUS
We rely on nature for material (agricultural products) and process (water, energy etc.) inputs for our business process viz., sourcing, processing, packaging, and distribution. We try to ensure that our environmental footprint is minimal and reversible.
FINANCIAL PRUDENCE
Optimal capital allocation to drive organic and inorganic growth.
GOVERNANCE AND RISK MANAGEMENT
Uphold the highest levels of corporate governance ensuring streamlined business operations. Our robust risk management framework enables us to identify, address and mitigate the existing and emerging risks that are posed to our business.

CONSUMER BEHAVIOUR AND TRENDS
Consumer connects, social listening, and understanding behavioural changes facilitates building purposeful brands

INNOVATION
By leveraging consumer insights, we continue to address untapped and emerging consumer needs through our product and category innovations

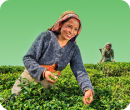
SOURCING
Sustainable sourcing is an integral part of our strategy; Transformation of our supply chain is helping us create a more efficient, cost-effective and sustainable footprint

MANUFACTURING AND PACKAGING
We are integrating operations and leveraging technology in our manufacturing processes and on packaging circularity

DISTRIBUTION
Our distribution networks work efficiently to take our products to millions of households

MARKETING AND SELLING
Transparency and responsible marketing have helped us enjoy high levels of consumer trust

FOR BETTER SOURCING
Dedicated to ensuring that our products are produced in an economically, environmentally, and socially just manner.
Sustainable value chains from farm to shelf.
Critical supplier assessments across all geographies by 2030
Sustainably sourced critical raw materials by 2040

FOR A BETTER PLANET
Committed to sustainable utilisation of major natural resources, such as land, water, air, and wild flora and fauna.
Clean energy, water replenishment, preservation of biodiversity, and circular economy.
By 2040 across all geographies
To landfill by 2030 across all geographies
Across all operations by 2030
Of packaging material to be recyclable, compostable, or reusable across all geographies by 2030

FOR BETTER COMMUNITIES
Belief in the Tata Group philosophy of giving back to the community and acknowledging the role played by communities in business growth.
Enhance the quality of life, creating shared value for our communities. Foster an equitable, inclusive, and safe culture.
Beneficiaries by 2030
Diverse workforce across all geographies by 2030

FOR BETTER NUTRITION
Portfolio of great-tasting products that are designed to enhance health and well-being.
Improved access to healthy, natural, and safe food for our consumers.
Households in India to be reached through our product portfolio by 2030
Sustainable products* by volume by 2040
Capitals

Financial

Intellectual

Human

Social and Relationship

Natural

Manufactured
Material Issues
Access to nutrition
Consumer Connect
Human Rights
Responsible Marketing
Value Chain Management
Community Engagement
Product Stewardship
Innovation & Technology
Circular Economy
Responsible Sourcing
Driving Net Zero
Preserving Nature & Biodiversity
Corporate Governance
Equitability
Employee wellness, Engagement and Health & Safety
Training and Education
CONSUMER
200+ Mn households reach in India
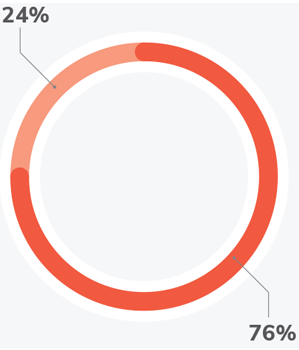
24% of new innovations focused on Health and Wellness
34 new products launched in India and other geographies
8 new products with additional nutritional attributes
Direct outlet reach of 1.5 million retail outlets and total reach of 3.8 million outlets
PEOPLE
1,200+ women in workforce
31% of the open positions filled by Internal transfers
95% talent retention (global graded population)
Diversity, Inclusion, Equity, Belonging DIEB - 77, Engagement Score - 73
Zero fatalities across manufacturing facilities
COMMUNITIES
12.5 lakhs beneficiaries positively impacted through our 10 CSR programmes
Collaborations and partnerships with Ethical Tea Partnership (ETP), trustea, India Plastics Pact, UK and EU Plastic Pacts
GOVERNMENT AND REGULATORY AUTHORITIES
Setting industry benchmarks and promoting the sustainability agenda
Transparency in financial reporting and tax matters; FY 22-23 INR 389 crores in direct taxes
INVESTORS
Making progress on ESG via our ESG strategy and through specific commitments on all parameters
Robust financial returns; FY 22-23 INR 558 crores distributed as dividends, up 40%. EPS up 28%
VALUE CHAIN PARTNERS
25% Growth in alternate channels
Mutually beneficial partnerships that help realise efficiencies
>2X the number of channel partners (distributors) from FY 20-21 to FY 22-23
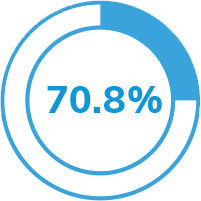
55% of Tata Tea sustainably sourced
ENVIRONMENT AND ECOSYSTEM
100% compliance with EPR
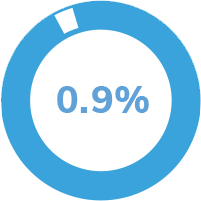
Support RE installations in supply chain - 19% renewable energy share.
Steady progress towards water neutrality
Workforce by region*


AUSTRALIA


INDIA


MIDDLE EAST


UK AND EUROPE

UK AND EUROPE

SOUTH AFRICA

CANADA

USA

Map not to scale
Geography / Contribution*
We remain committed to strengthening and accelerating our core business through strategic efforts in key identified areas. Our focus has been on strengthening our brands, expanding our market presence, and delivering innovative products.
Know More
We are utilising digital technology to obtain new insights and knowledge about markets and consumers and streamline our operations and systems.
Know More
We continued to drive synergies and simplification across the organisation. During the year, we have progressed restructuring initiatives, enabled faster integration of acquisitions and increased supply chain efficiency.
Know More
We are continually exploring and evaluating new opportunities to grow organically and inorganically. During the year, we entered new Horizon-3 categories under the protein platform, forayed into new markets and...
Know More
At Tata Consumer, we understand that leveraging the diversity of our employees, investing in their capabilities, and creating a culture that promotes a growth mindset are critical to achieving our aspiration of becoming a premier FMCG organisation.
Know More
Acting responsibly towards all our stakeholders underpins the way we do business at Tata Consumer. Our ESG strategy ‘For Better Living’ embodies this spirit and guides our efforts towards better living for our consumers, employees, investors, and value chain partners.
Know More
 CONSUMERS
 PEOPLE
 COMMUNITIES
 GOVERNMENT AND REGULATORY AUTHORITIES
 INVESTORS
 VALUE CHAIN PARTNERS
 ENVIRONMENT AND ECOSYSTEM